model = select_asap_model('SiC')print(f'Using potential model: {model}')sys_size ='3x3x3'sc = [int(v) for v in sys_size.split('x')]cryst = bulk('SiC', crystalstructure='zincblende', a=4.38120844, cubic=True).repeat(tuple(sc))cryst.calc = create_asap_calculator(model)hecss = HECSS(cryst, lambda : create_asap_calculator(model), pbar=False)hecss.estimate_width_scale(10, Tmax=1000);
Using potential model: MEAM_LAMMPS_KangEunJun_2014_SiC__MO_477506997611_000
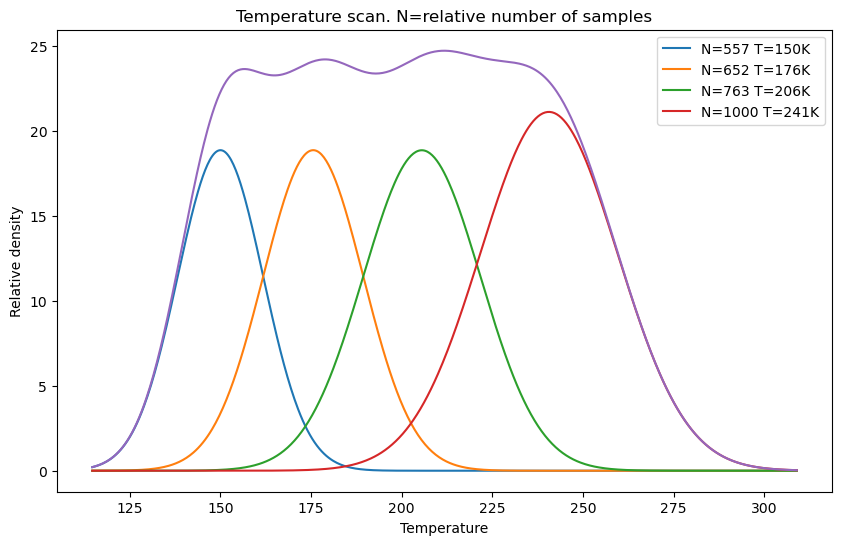
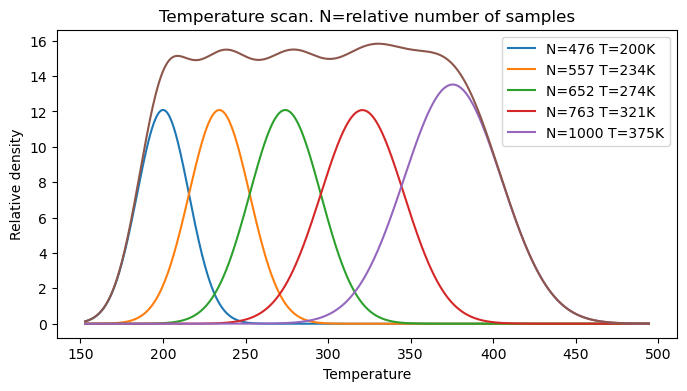
N =1_000plt.figure(figsize=(10,6))plan = plan_T_scan(150, 250, len(cryst), N)
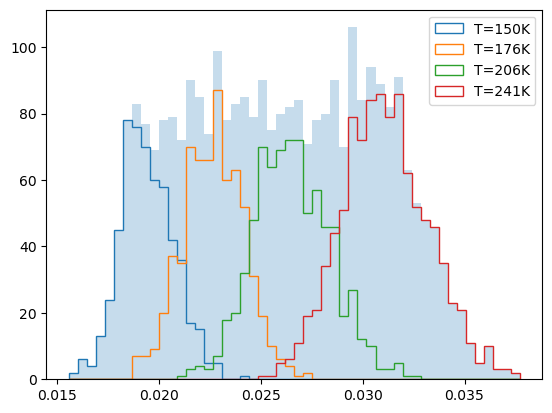
smpls = {}for T, sig, n in tqdm(plan):# sampler = HECSS_Sampler(cryst, asap3.OpenKIMcalculator(model),# T, N=int(n), pbar=tqdm(total=n)) smpls[T]=np.array([s[-1] for s in hecss._sampler_ser(T, n)])# ell = [np.array([s[-1] for s in sl]) for sl in smpls.values()]
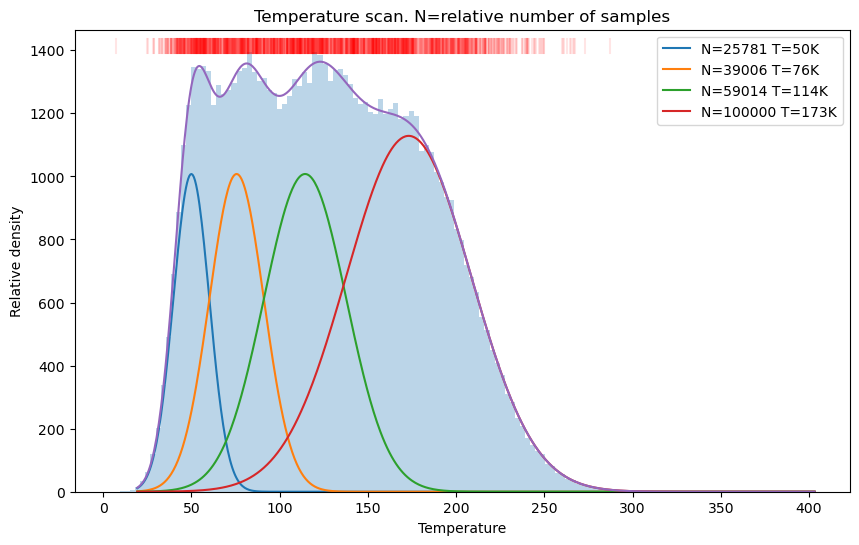
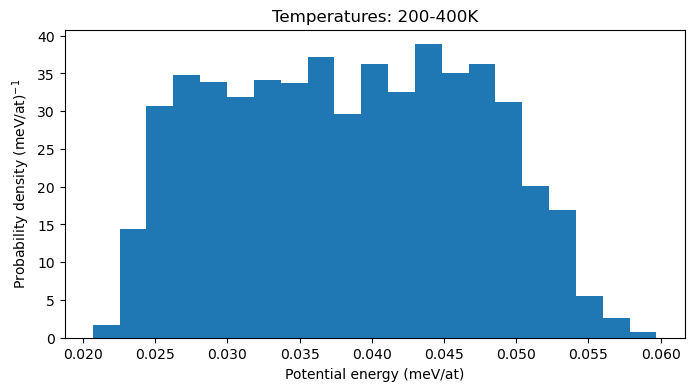
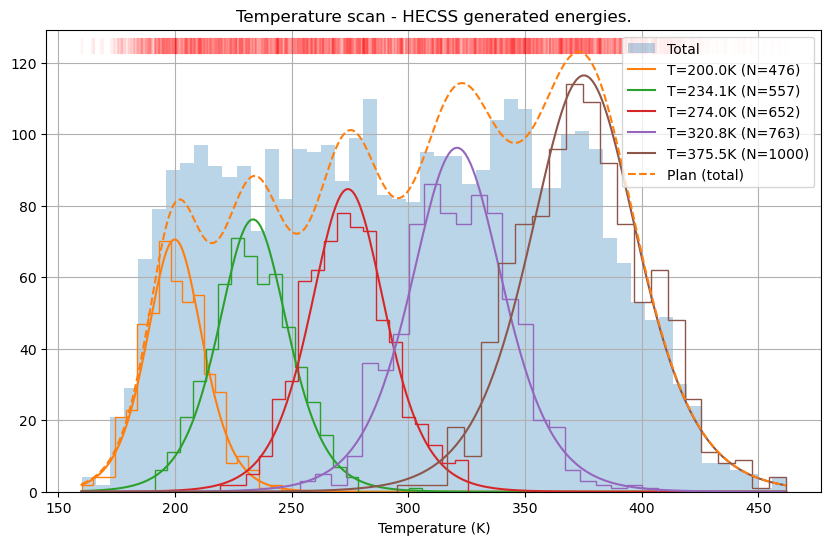
N =1000plt.figure(figsize=(8,4))plan = plan_T_scan(200, 400, len(cryst), N)plt.savefig('AUX/T_scan_plan.pdf', bbox_inches='tight')
smpll = []for T, sig, n in tqdm(plan): smpll.append([s for s in hecss.sample(T, n)])ell = [[s[-1] for s in sl] for sl in smpll]
usmp = []for sl in smpll: usmp += sl
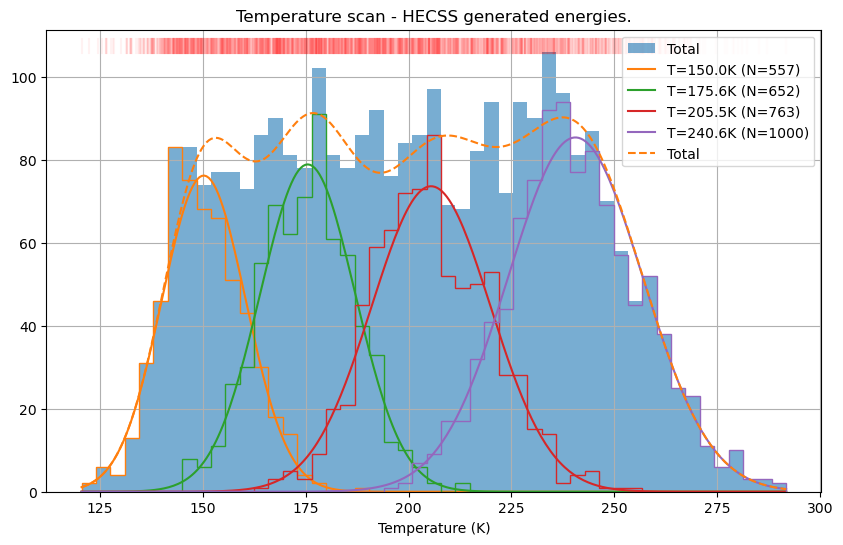
plt.figure(figsize=(8,4))plt.hist([s[-1] for s in usmp], bins='auto', density=True)plt.xlabel('Potential energy (meV/at)')plt.ylabel('Probability density (meV/at)$^{-1}$')plt.title('Temperatures: 200-400K')plt.savefig(f'AUX/uniform.pdf', bbox_inches='tight')